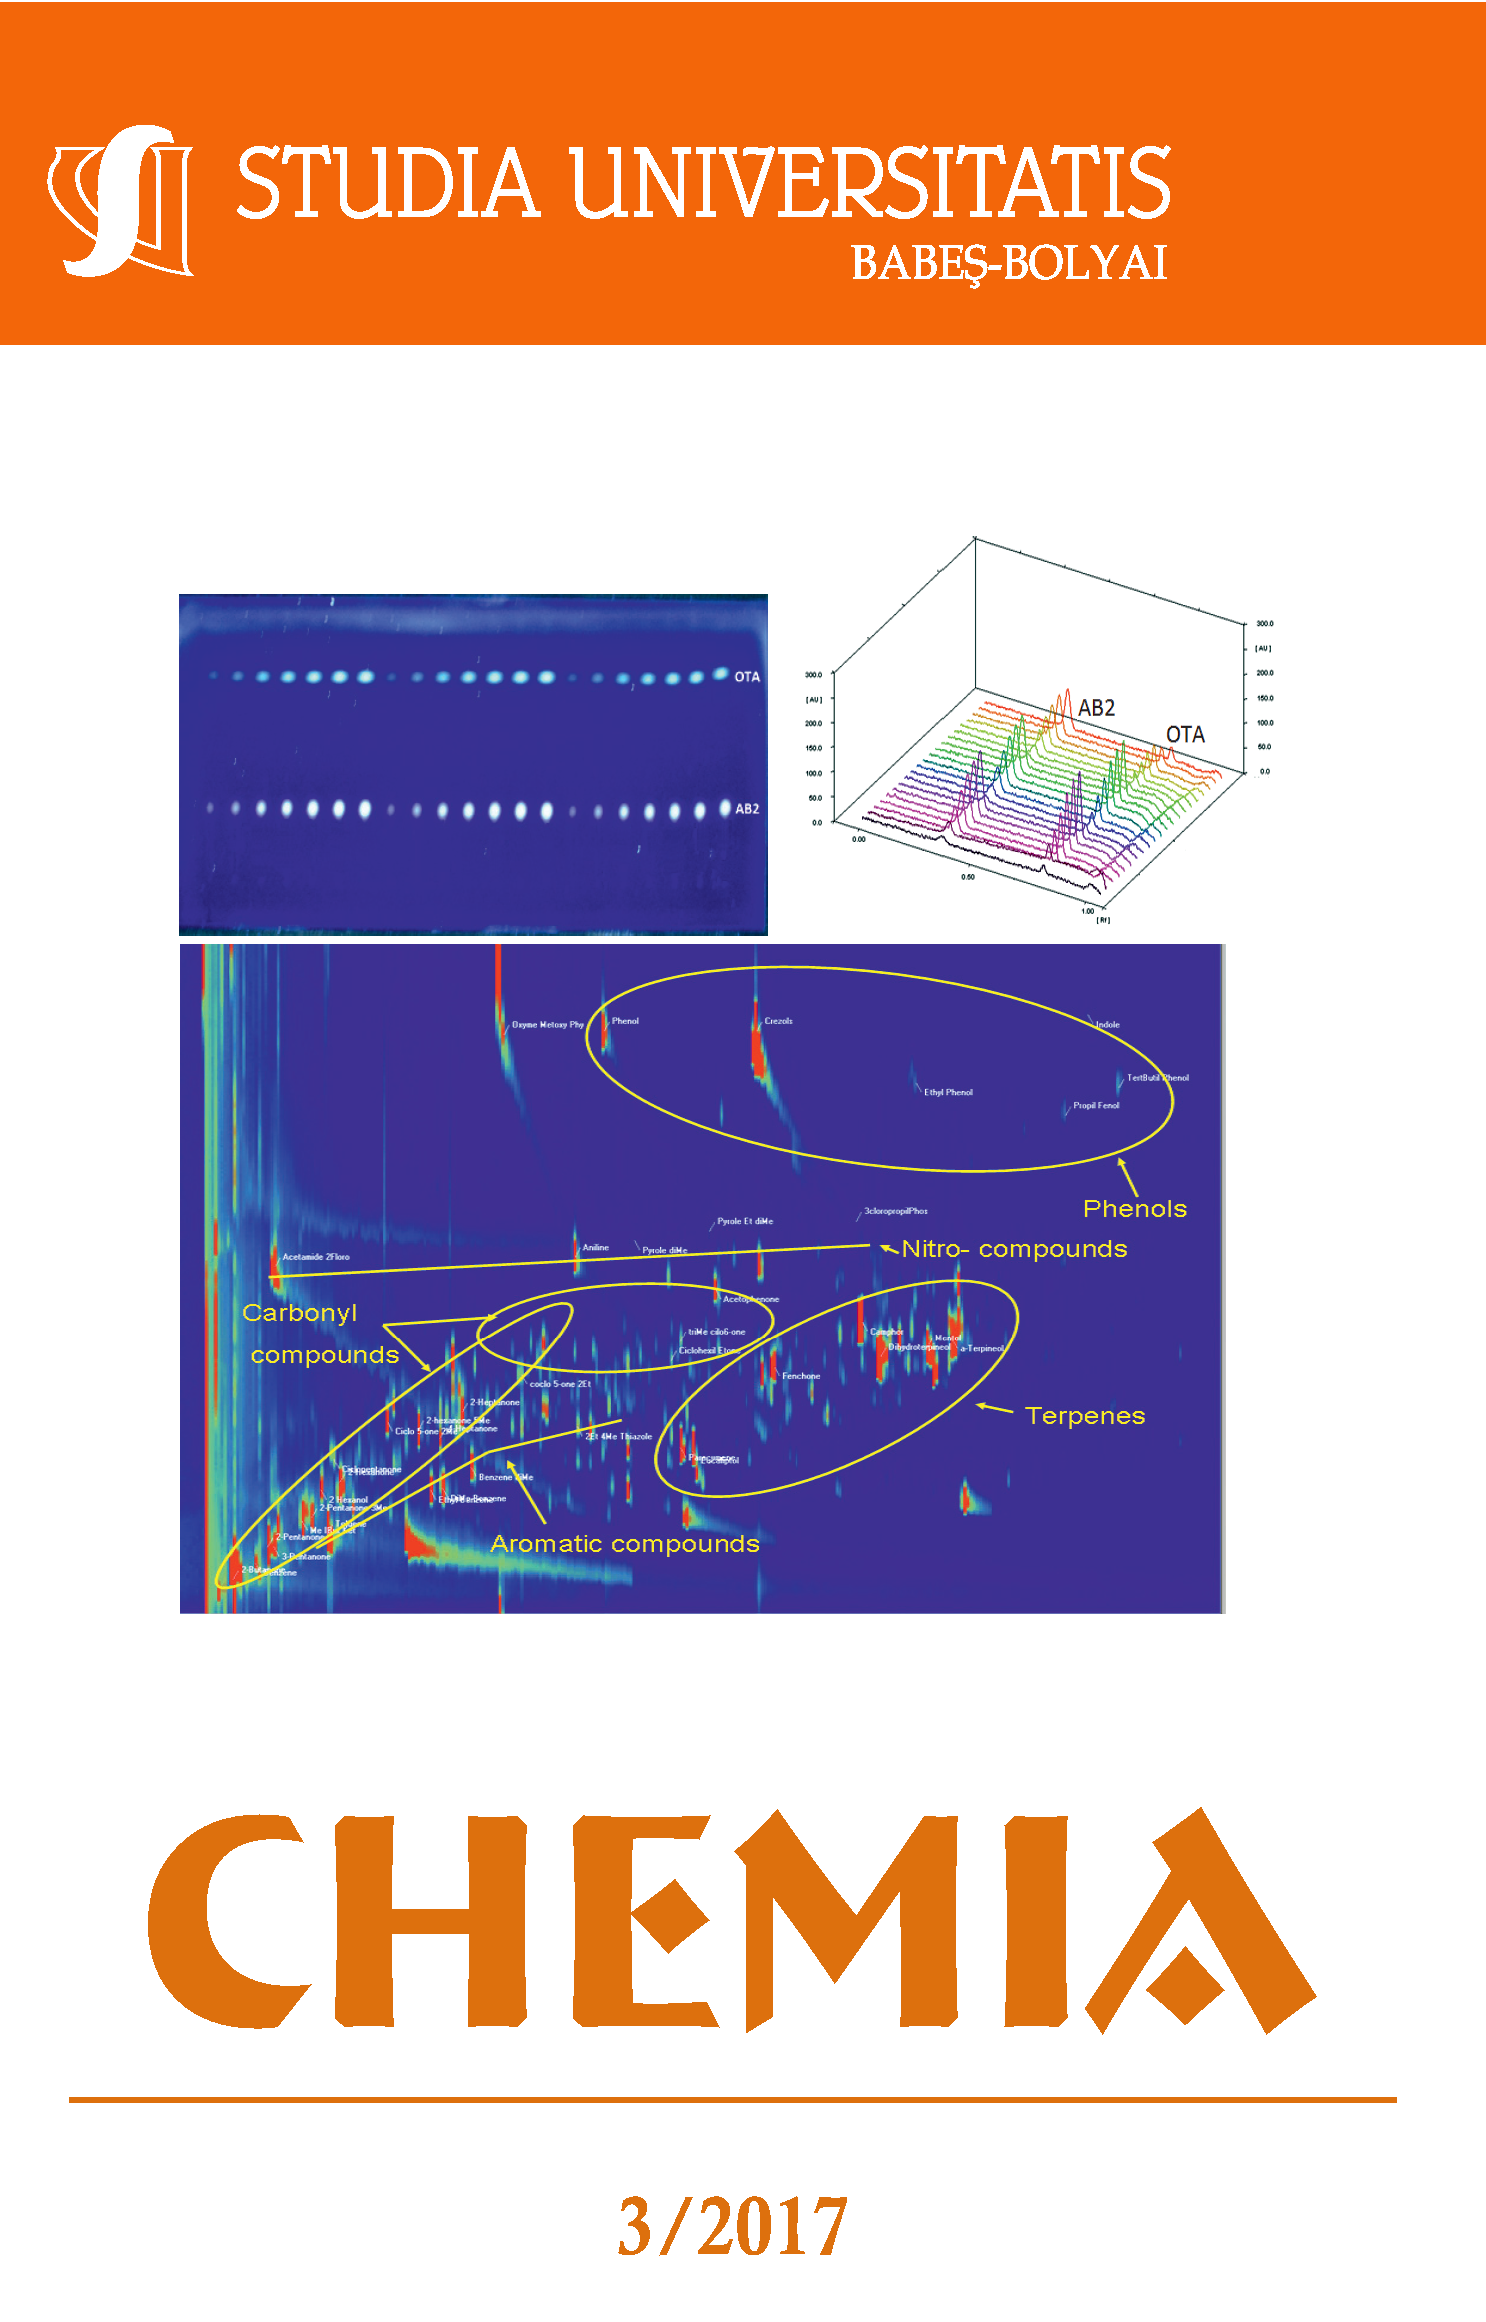
INVESTIGATION ON IMAGE PROCESSING PARAMETERS FOR PLATE EVALUATION IN TLC ANALYSIS OF MYCOTOXINS
DOI:
https://doi.org/10.24193/subbchem.2017.3.07Keywords:
aflatoxin B1, ochratoxin A, TLC; densitometry, image processingAbstract
Based on advantages of available modern image processing techniques, thin-layer chromatography combined with image analysis becomes a promising alternative for the mycotoxins determinations in various foodstuffs. For this, the effect of digitizing channel selection and image processing parameters on aflatoxin B2 (AB2) and ochratoxin A (OTA) determination was evaluated and the obtained results were compared with those of classical photodensitometric analysis. The best exciting wavelength for OTA was found to be λexcitation=333nm while for AB2 λexcitation=365nm. Low detection and quantification limits were determined (LODOTA=0.310ng/spot; LOQOTA=0.616ng/spot, LODAB2=0.557ng/spot, LOQAB2=1.098ng/spot). For image processing, the parameter with the highest influence upon the regression calibration curve was brightness and the best digitizing channel was found to be the green one. First-order calibration curve with a good determination coefficient (R2>0.99) were obtained on the working range of 2.5-50ng/spot. Although image processing techniques do not provide higher LOD and LOQ values than classical photodensitometry, this method offers the advantage of simultaneous quantification of both mycotoxins.
References
J. M. Jay, M. J. Loessner, D. A. Golden, “Modern Food Microbiology”, 7-th Edition, Springer, New York, 2005.
J. I. Pitt, A. D. Hocking, “Fungi and Food spoilage”, 2-nd Edition, Springer, New York, 2009.
S. Z. Iqbal, M. R. Asi, A. Arino, “Aflatoxins” in “Brenner's Encyclopedia of Genetics”, 2-nd Edition, Elsevier, London, 2013.
R. C. Gupta, M. A. Lasher, I. R. Miller Mukherjee, A. Srovastava, R. Laal, “Aflatoxins, Ochratoxins, and Citrinin” in “Reproductive and Developmental Toxicology”, 2-nd Edition, Elsevier, London, 2017.
Commission Regulation (EC) No 1881/2006 of 19 December 2006, “Setting of maximum levels for certain contaminants in foodstuffs”, http://eur-lex.europa.eu/legal-content/EN/TXT/?uri=CELEX%3A32006H0576
M. Miraglia, B. De Santis, S. Grossi, C. Brera,” Mycotoxins” in “Handbook of food analysis”, 2-nd Edition, Marcel Dekker, New York, 2004
N. W. Turner, S. Subrahmanyam, S. A. Piletsky, Analytica Chimica Acta, 2009, 632, 168.
A. Rahmany, S. Jinap, F. Soleimany, Chomprehensive review in food science and food safety, 2009, 8, 202.
A. Raiola, G. C. Tenore, L. Manyes, G. Meca, A. Ritieni, Food and Chemical Toxicology, 2015, 84, 169.
N. W. Turner, H. Bramhmbhatt, M. Szabo-Vezse, A. Poma, R. Coker, S. A. Piletsky, Analytica Chimica Acta, 2015, 901, 12.
L. Wang, Z. Wang, W. Gao, J. Chen, M. Yang, Y. Kuang, L. Huang, S. Chen, Food Chemistry, 2013,138, 1048.
Q. Liu, W. Kong, W. Guo, M. Yang, Journal of Chromatography B, 2015, 988, 175.
D. Alkadri, J. Rubert, A. Prodi, A. Pisi, J. Manes, C. Soler, Food Chemistry, 2014, 157, 111.
L. Wang, Z. Wang, C. Tessini, C. Mardones, D.von Baer, M. Vega, E. Herlitz, R. Saelzer, J. Silva, O. Torres, Analytica Chimica Acta, 2010, 660, 119.
A. Prelle, D. Spadaro, A. Garibaldi, M. L. Gullino, Food Control, 2014, 39, 192.
N. Arroyo-Manzanares, J. F. Huertas-Perez, L. Gamiz-Gracia, A. M. García-Campana, Talanta, 2013, 115, 61.
A. Kamkar, Food Control, 2006, 17, 768.
A. A. Fallah, Food Control, 2010, 21, 1478.
S. A. Bankole, A. A. Adenusi, O. S. Lawal, O. O. Adesanya, Food Control, 2010, 21, .974.
I. Kamika, L. L. Takoy, Food Control, 2011, 22, 1760.
M. Mulunda, D.Mike, Food Control, 2014, 39, 92.
A. A. Fallah, M. Rahnama, T. Jafari, S. Siavash Saei-Dehkordi, Food Control, 2011, 22, 1653.
I. Var, B. Kabak, F. Gok, Food Control, 2007, 18, 59.
C. Braicu, C. Puia, E. Bodoki, C. Socaciu, Journal of Food Quality, 2008, 31(1), 108.
Downloads
Published
How to Cite
Issue
Section
License
Copyright (c) 2017 Studia Universitatis Babeș-Bolyai Chemia

This work is licensed under a Creative Commons Attribution-NonCommercial-NoDerivatives 4.0 International License.


